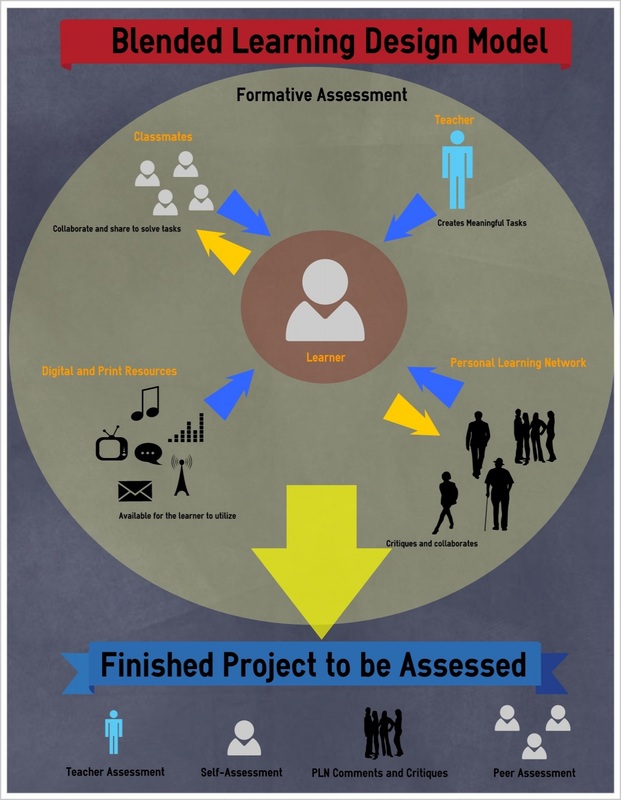
A visual representation of my thoughts on blended learning. This diagram was created in order to respond to the varying learning models that are possible within an online or blended environment. I chose to create an overarching model with large themes in order to represent the interactions a learner may have in a blended learning environment.
In the creation of this model I was able to experience a new tool, create a coherent model for how I tend to teach, and better understand the theories present in my everyday teaching. I was successful in meeting the program learning outcome that involved integrating current cognitive learning and brain based learning theory into my practice. Through the creation of this assignment I was able to examine the current research and evaluate my own practice. It is also one of a number of pieces of evidence that demonstrate my ability to show competencies with online learning tools.
After doing some research on visual infographics I determined that Easel.ly was an excellent tool to use to create this, and future, infographics. The tool itself was simple to learn, however, the fact that it exists now provides me with an opportunity to have students create similar infographics. In addition to learning a new tool this model gave me the opportunity to place all my teaching strategies on paper in a single coherent place. Through this act I was able to determine which strategies worked, which really didn’t, and combine a few of the outliers. Finally, the research was interesting and I hope to have it further guide my masters work in the coming years.
Making choices in my classroom that is informed by dedicated research is an important part of my overall teaching journey. As someone who bases much of my decisions on data, having a concrete understanding of the various methods available to me in a blended learning environment will be useful in planning future blended learning courses. Furthermore, the discovery of this tool will allow both myself, and my students, an easy way to create engaging infographics to demonstrate content or learning. I’m pleased with the creation of my learning model and look forward to further investigating how I deliver course content in a blended learning environment.
 RSS Feed
